Neighborhood-Level Factors That Quietly Shape Dayton Car Insurance
How Local Streets Quietly Shape Your Insurance Costs
Car insurance pricing is often described in terms of broad personal factors such as age, driving record, and vehicle type. Yet, from an underwriting and risk-modeling standpoint, geography is not simply a matter of city or ZIP code. Insurers analyze risk at a much finer spatial scale, incorporating patterns that emerge from specific neighborhoods, corridors, and even individual intersections. Two policyholders with comparable vehicles and driving histories can face meaningfully different premiums because their daily exposure to risk differs at the level of local streets and parking environments.
This article examines the ways local traffic patterns, crime and parking environments, micro-climate and roadway conditions, demographic and land-use changes, telematics data, and the local repair market influence auto insurance costs in and around Dayton, Ohio. The goal is to provide a more systematic and conceptually grounded view of how localized risk factors are incorporated into insurance pricing and coverage decisions. While specific carrier algorithms are proprietary, the general mechanisms discussed here broadly reflect contemporary practices in personal auto insurance underwriting.
We also consider how individual drivers can use an understanding of these neighborhood-level dynamics to evaluate their own exposure more accurately and align their coverage choices with the actual risks they face on the roads and in the parking environments they use most frequently.
I. Traffic Patterns and Commute Routes as Risk Exposures
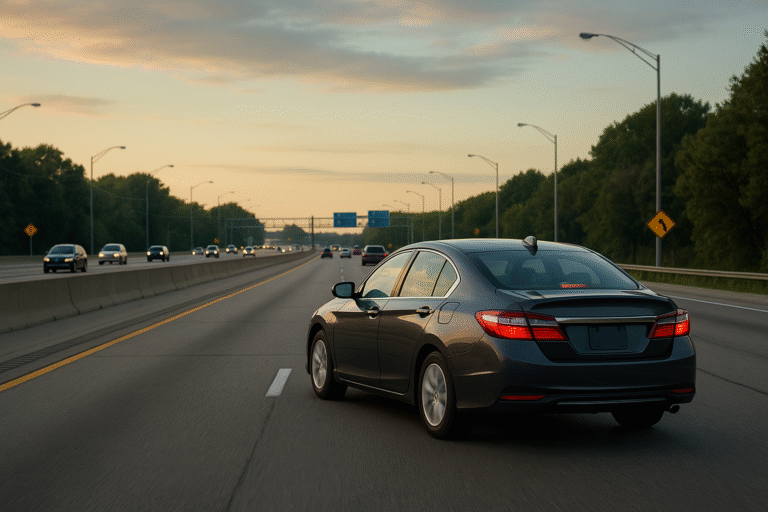
When most drivers think of their “location” for insurance purposes, they tend to focus on their home address, where their vehicle is garaged overnight. Insurers do treat the garaging address as a foundational rating variable, but it captures only one dimension of geographic risk. The other dimension is the pattern of daily movement: where, when, and how the car is driven across the region.
From an actuarial perspective, a driver’s commute and routine travel patterns are primary determinants of exposure frequency. A vehicle used primarily in low-speed, low-volume environments is not exposed to the same collision probabilities as a vehicle that regularly operates in dense traffic or at highway speeds.
Within the Dayton area, typical patterns might include:
- Regular commuting on interstate corridors such as I-75 or I-70, with sustained higher speeds and heavier volumes
- Frequent use of surface streets near downtown Dayton, characterized by signalized intersections, lane changes, and short-distance stop‑and‑go traffic
- Suburban circulation around communities such as Beavercreek, Washington Township, Springboro, or Huber Heights, often involving a mix of collector roads, retail corridors, and school zones
Insurers and their data partners examine patterns such as:
- Common commute corridors used most weekdays and their historical collision frequencies
- Temporal congestion patterns (e.g., morning and evening rush hours) that correlate with rear‑end collisions and intersection crashes
- Crash and claim rates associated with specific intersections and roadway segments
- The long-term impact of seasonal construction zones that alter traffic flows and increase conflict points
Even if an individual driver has never filed a claim, their exposure is estimated as part of a broader risk pool that includes others who drive similar routes at similar times. If, for example, a particular stretch of an arterial road experiences an increase in multi-vehicle crashes over several years, that trend will be reflected statistically in the expected loss costs for that micro‑area. Those loss costs, in turn, influence premiums for policyholders whose garaging and usage characteristics indicate regular exposure to those corridors.
Seasonal construction is a good illustration. During spring and summer, construction activity tends to intensify. Lane closures, temporary traffic patterns, detours, and work zones alter typical driver behavior. Detours may push more vehicles onto residential side streets, introduce unfamiliar left turns and merges, and lengthen queues at stop signs or temporary signals. Each of these changes introduces additional opportunities for driver error and minor collisions.
When considering your own insurance, it is therefore useful to evaluate your real exposure:
- Do your regular trips primarily involve interstate highways, urban arterials, or low‑volume neighborhood roads?
- Does your work or school schedule place you in peak congestion windows on a daily basis?
- Do you routinely use specific high‑volume corridors or complex intersections as time‑saving shortcuts?
Different insurers weigh these exposure elements with varying emphasis. Some carriers may be more comfortable, based on their own claim experience and telematics data, with highway-heavy commutes. Others may price more conservatively around dense downtown traffic or newly congested suburban development. This is one reason that a personalized quote process can produce a meaningful spread in prices for two drivers whose lifestyles look similar at first glance, but whose detailed route patterns differ.
II. Crime, Vandalism, and the Role of Parking Environments
Where a vehicle is parked, particularly overnight, constitutes a distinct category of risk separate from its on‑road exposure. Comprehensive and, in some contexts, collision coverage costs are heavily influenced by the historical frequency and severity of losses in specific parking environments.
Insurers draw on police reports, claim databases, and third‑party crime analytics to assess how often parked vehicles in a given micro‑area are:
- Stolen or involved in attempted theft or joyrides
- Broken into for theft of contents or components
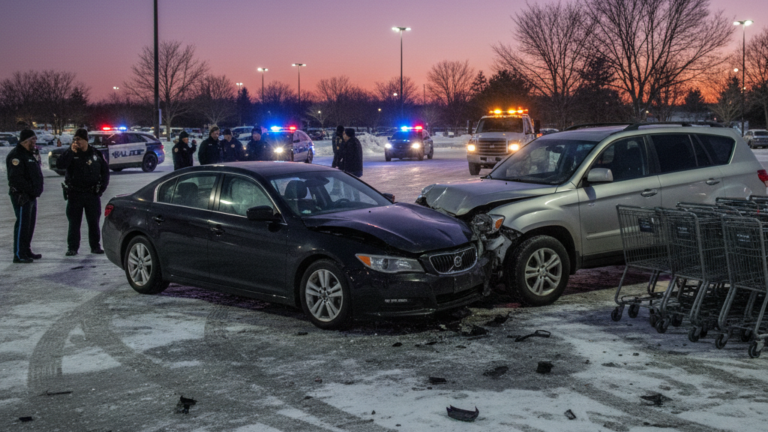
- Damaged while legally parked along busy streets (e.g., sideswipes, hit‑and‑run incidents)
- Subject to deliberate vandalism, such as graffiti, keyed panels, or broken glass
Consider two otherwise identical vehicles:
- Vehicle A: Garaged in a private driveway or enclosed garage on a quiet residential street with adequate lighting and limited through‑traffic
- Vehicle B: Parked most nights on the street near a nightlife or high‑activity retail area with higher foot traffic and more unknown individuals passing through
Statistically, Vehicle B faces higher odds of theft, vandalism, or incidental damage, even if both owners exercise similar levels of personal caution. Over time, claim experience in these contrasting environments leads to different expected loss costs at the micro‑area level.
These patterns are not limited to the home environment. During spring and summer months, drivers often increase their use of:
- Parks, recreational facilities, and green spaces
- Festivals, outdoor concerts, and community events
- Busy shopping centers, restaurant districts, and sports venues
Parking facilities in these locations, often large lots with tight spaces and high turnover, see elevated frequencies of low‑severity incidents such as door dings, scraped bumpers, or backing collisions. In some areas, opportunistic theft of items left in vehicles may also rise during peak periods. When insurers observe consistent claim clustering around certain ZIP codes, blocks, or specific clusters of lots, those patterns gradually influence the risk factors associated with vehicles that are garaged nearby and plausibly exposed to those environments.
If your vehicle frequently:
- Spends nights on the street rather than in a garage or off‑street driveway
- Sits near large public parking facilities or event venues
- Remains for extended periods near busy commercial zones
then, statistically, your risk profile differs from someone whose vehicle rarely leaves a private, secured parking space. Recognizing this does not mean altering your lifestyle to avoid such environments, but it does argue for aligning your comprehensive and collision coverage choices with the ways your vehicle is actually exposed to crime and incidental damage risk.
III. Weather Microclimates and Roadway Conditions in the Dayton Region
Regional climate summaries can obscure significant variations in local weather impacts. In practice, neighborhoods within the same metropolitan area may experience quite different patterns of precipitation, temperature, and wind exposure due to topography, vegetation, drainage infrastructure, and the built environment.
Insurers pay particular attention to how localized weather interacts with roadway and parking conditions to produce claims. Key categories include:
- Flood- and water-related damage near creeks, rivers, low‑lying underpasses, or areas with inadequate drainage
- Hail and wind events affecting vehicles parked outdoors without shelter
- Weather-related collisions on slick, narrow, shaded, or hilly road segments
In parts of the Dayton region, intense rainstorms can rapidly exceed the capacity of storm drains or roadside ditches, causing localized flooding. Standing water may accumulate under bridges, in low sections of roadways, or in poorly graded parking lots. Drivers who misjudge water depth or attempt to traverse flooded segments can experience severe engine damage or total loss.
Freeze-thaw cycles in Ohio are particularly damaging to pavement. As water infiltrates cracks and expands during freezing, asphalt deteriorates, leading to potholes and uneven surfaces. The rate at which local jurisdictions or property owners repair these defects varies, and some neighborhoods may see chronic pavement problems. This contributes to claims involving:
- Tire and wheel damage
- Suspension and steering component failures
- Loss-of-control incidents resulting from abrupt evasive maneuvers to avoid potholes or ruts
Although many of these incidents involve only a single vehicle, they appear in insurers’ data and are tracked by area. Micro‑areas with persistent roadway degradation can develop higher frequencies of physical damage claims relative to neighboring districts with more consistently maintained roads.
Seasonal and transitional periods bring additional complications:
- Heavy spring rainstorms with rapidly changing conditions and reduced visibility
- Fog along rural or semi‑rural corridors affecting sight distance and reaction times
- Strong thunderstorms, sometimes accompanied by hail or falling branches
- Late- or early-season snow and ice events that leave shaded, curvy, or hilly residential streets slick long after major routes have cleared
Neighborhoods with mature tree canopies over the roadway may experience higher frequencies of claims from falling limbs, especially during wind or ice storms. Areas with older drainage infrastructure may see more ponding on roads and in lots. These features, when combined with traffic volume, shape localized loss patterns.
When reviewing physical damage coverage, it can be useful to consider questions such as:
- Do you regularly park under large trees or near older structures that tend to drop debris during storms?
- Does your neighborhood or workplace area accumulate water or flood easily after heavy rain?
- Are your daily routes on streets where snow and ice remain longer due to shade, slope, or limited plowing?
Answering these questions can guide the selection of comprehensive and collision coverage levels, as well as deductible amounts, that more accurately reflect your exposure to localized weather and road condition risks.
IV. Demographic and Land‑Use Shifts Along Your Routes
Neighborhoods and corridors are dynamic, not static. Over relatively short periods, an area may experience new residential development, changes in household composition, or the introduction of new commercial and institutional uses. These shifts alter traffic characteristics and, ultimately, claim patterns.
On the demographic side, insurers do not price directly on sensitive personal attributes; however, they can observe how broader population trends influence traffic behavior. For example:
- A growing share of renters may correspond with more frequent move‑in/move‑out activity, including moving trucks and unfamiliar drivers navigating residential streets
- An increase in young drivers in an area may correlate with a higher rate of first‑time driving errors, particularly near schools, retail areas, or entertainment clusters
- A relatively older population may be associated with slower reaction times or a higher incidence of medical events behind the wheel
These characteristics are not inherently positive or negative; they simply contribute to the aggregate driving environment. Over time, they shape the frequency and severity of crashes noted in an insurer’s experience for a given micro‑area.
Land‑use changes exert a similarly important influence. When a new shopping plaza, school, warehouse, or sports complex opens, traffic patterns often shift substantially:
- New access points and turning movements introduce additional conflict points
- Delivery trucks and service vehicles add slower, larger, and less maneuverable traffic to the mix
- Teen drivers and young adults may concentrate around schools, quick‑service restaurants, and entertainment venues at particular times of day
- Weekend and evening traffic spikes may arise in areas that were previously quiet outside of commuter hours
Such changes tend to increase the number of low‑speed collisions in parking lots, backing incidents in driveways and alleys, and intersection collisions at newly busy junctions. The introduction or expansion of warehouse and industrial facilities can place more large commercial vehicles on certain corridors, increasing not only the probability of certain collision types but also their potential severity.
Insurers monitor these developments gradually, based on evolving data rather than immediate reactions. Claim patterns associated with the new uses must be observed over time before they substantially influence rating. Nevertheless, drivers whose daily routes have shifted due to local development may already be experiencing a different risk environment, more congestion, more complex turning movements, or more mixed traffic, whether or not premiums have fully adjusted.
From a coverage planning perspective, it can be useful to take note of changes along your regular routes:
- Have new schools, multifamily communities, or commercial centers opened near your path to work or school?
- Has truck traffic increased along what was previously a relatively quiet back‑road shortcut?
- Are there new access points or intersections that appear to generate confusion or near‑misses?
Recognizing these shifts can motivate a review of liability limits and physical damage coverage to ensure that they remain appropriate for the evolving exposure environment.
V. Telematics and the Finer Resolution of Neighborhood Risk
Telematics and usage‑based insurance (UBI) programs have transformed how insurers measure individual driving behavior. These programs typically rely on a smartphone application or a plug‑in device to capture trip-level data, including driving times, speeds, and specific maneuvers.
From the driver’s viewpoint, telematics programs commonly assess variables such as:
- Frequency and intensity of hard braking or rapid acceleration
- Nighttime driving, particularly during late‑night hours associated with higher crash and impairment risks
- Time spent driving during congested peak periods
- Speeding relative to posted limits
From the insurer’s perspective, however, the aggregated and anonymized data from many participating vehicles provide an additional layer of geographic insight. They can use telematics data to identify:
- Corridors where sudden braking and near‑miss patterns are frequent, even without a correspondingly high rate of reported crashes
- Locations where speeding is consistently observed, suggesting a higher potential for severe crashes
- Intersections or road segments with confusing geometry or signal timing that induce risky maneuvers
- Time windows during which certain roads exhibit markedly elevated risk
These insights allow insurers to refine their understanding of neighborhood-level risk beyond what traditional crash statistics can reveal. For example, a road that currently has a modest number of recorded accidents might nevertheless show telematics evidence of widespread speeding and frequent hard‑braking events, indicating that the risk profile could deteriorate as volumes increase.
For careful drivers living in areas that appear “high risk” on paper, telematics can serve as a counterweight. If your personal driving behavior shows consistent adherence to speed limits, gentle braking and acceleration, avoidance of late‑night driving, and limited exposure to the most congested periods, a UBI program may demonstrate that you are a lower‑than‑average risk within your neighborhood pool. In some cases, that may help secure a better rate than would be offered based solely on traditional rating variables.
Conversely, telematics can highlight behaviors that elevate risk. Habitually using known speeding corridors, engaging in aggressive acceleration or braking in congestion, or consistently driving at high‑risk times may be reflected in the telematics score. In that scenario, the individual’s risk profile may be higher than the average for their area, and premiums may adjust accordingly.
Before enrolling in a telematics program, it is prudent to reflect on:
- Your comfort level with sharing driving data and the privacy and data‑usage policies of the program
- Your typical daily and weekly driving patterns in the Dayton area (routes, times, and traffic conditions)
- Your willingness to alter certain habits (for example, avoiding hard braking or late‑night trips) to potentially improve your telematics score
This type of self‑assessment can help determine whether a telematics-based policy aligns with your driving style and risk tolerance.
VI. Vehicle Mix, Local Repair Markets, and Claim Costs
Geographic risk is not only about how vehicles are driven and where they are parked. It is also about what vehicles are present and how costly they are to repair or replace. Within a metropolitan area, some neighborhoods have a higher prevalence of older sedans and compact cars, while others feature newer SUVs, pickup trucks, and electric or hybrid vehicles.
The composition of the local vehicle fleet influences average claim severity. Modern vehicles often incorporate advanced driver‑assistance systems (ADAS) such as forward‑collision warning, adaptive cruise control, lane‑keeping assistance, and blind‑spot monitoring. While these technologies can reduce the frequency of certain collisions, they also increase the complexity and cost of repairs when a crash does occur.
For instance, front and rear bumpers, mirrors, and windshields may house sensors, cameras, or radar units that require specialized parts and precise calibration after a repair. Even seemingly minor fender‑bender damage can translate into higher parts and labor costs. Insurers monitor claim data to evaluate how these technological features influence severity in different areas.
The local repair ecosystem around Dayton also plays a significant role. Claim costs are shaped by:
- The availability and capacity of body shops, glass specialists, and mechanical repair facilities
- Turnaround times for repairs and the availability of substitute transportation (e.g., rental vehicles) while cars are in the shop
- Parts availability and sourcing strategies (original equipment versus alternative parts)
- Existing relationships and repair protocols between insurers and local shops
Areas with robust, efficient repair networks and relatively stable labor costs may see more predictable and manageable claim expenses. In contrast, where repair capacity is constrained, parts are difficult to source, or specialized equipment is required, repair times may lengthen and costs may rise. These additional expenses, including extended rental coverage and storage, are incorporated into the loss experience associated with vehicles garaged in those areas.
Macroeconomic factors, such as broader inflation in vehicle prices and repair costs, overlay these local dynamics. As vehicles become more technologically sophisticated and as labor and materials costs increase, even low‑severity collisions can generate larger claim amounts than in prior years. When the average claim size observed in a given neighborhood or micro‑territory rises over time, insurers must adjust their expected loss costs and, ultimately, the rates applied to that area.
All of these elements underscore an important point: an individual policyholder’s premium reflects not only their own driving characteristics but also the behavior, composition, and repair experience of the vehicle population around them.
VII. Applying Neighborhood-Level Insights to Your Own Coverage Choices
Understanding that insurance pricing and coverage decisions operate at a neighborhood level rather than a purely citywide scale can make the process of evaluating your policy more concrete. Instead of viewing your premium as an opaque number, you can relate it to specific aspects of your daily life in and around Dayton.
Several practical steps can help you apply these insights:
1. Map your actual driving exposure.
Consider where your vehicle spends time during an average week:
- Commutes to work, school, or regular activities
- Routine trips for groceries, errands, and appointments
- Weekend outings, seasonal recreation, and social events
Note whether these routes involve interstates, dense urban streets, school zones, or low‑volume residential roads, and at what times you typically drive.
2. Account for seasonal variation.
Your exposure may change by season:
- Spring and summer might involve more park visits, festivals, and road trips on I‑75 or I‑70
- Fall and winter may prompt route changes to avoid hills, shaded areas prone to ice, or poorly plowed side streets
These seasonal shifts alter your risk profile over the year and may justify periodic coverage reviews.
3. Evaluate your physical damage coverage.
If your vehicle often sits on the street, under large trees, near areas that puddle or flood, or in heavily used public lots, you face a different comprehensive and collision risk than someone whose car rarely leaves a secure garage. Consider:
- Whether comprehensive coverage limits and deductibles appropriately reflect potential losses from theft, vandalism, hail, falling objects, or water damage
- Whether collision coverage and deductibles are well‑matched to your budget and the likely severity of crash-related repairs in your daily environments
4. Reassess your liability limits in light of your routes.
Drivers who regularly operate in high‑speed or high‑volume corridors, or in areas with complex traffic patterns and heavy truck presence, may face a higher probability of serious injury or multi‑vehicle collisions. In such cases, minimum state liability limits may not provide sufficient financial protection. Reviewing higher liability limits can offer more robust protection against claims arising from severe accidents.
5. Consider whether telematics is appropriate for you.
If your driving patterns tend to involve calmer hours, moderate speeds, and relatively uncongested routes, and if you are comfortable with the data‑sharing aspects, a telematics program may more precisely reflect your individual risk compared to area averages. On the other hand, if your schedule forces frequent late‑night driving, heavy congestion, or hurried commutes, you may wish to weigh the potential impact on your premium before opting in.
6. Monitor local changes.
Observe ongoing development and infrastructure changes along your regular routes:
- New schools, retail centers, distribution hubs, or residential complexes
- Reconfigured intersections, added traffic signals, or new access points
- Long-term construction projects altering traffic patterns
These changes can foreshadow shifts in risk and may indicate that it is time to review your coverage structure.
VIII. Conclusion: From Opaque Pricing to Informed Decisions
Auto insurance premiums in Dayton are shaped by far more than broad personal characteristics and citywide averages. At the core of modern underwriting is a granular assessment of how, where, and when risk materializes on local streets, in parking environments, and within the broader vehicle and repair ecosystem.
- Traffic patterns and commute routes influence the frequency and severity of collision exposure
- Crime rates and parking conditions affect the likelihood of theft, vandalism, and incidental damage
- Weather microclimates and roadway conditions drive localized spikes in comprehensive and collision claims
- Demographic and land‑use shifts gradually reshape the risk landscape along specific corridors
- Telematics data refines the resolution of these patterns, capturing real‑world behavior at the street level
- Vehicle mix and local repair market dynamics determine how costly claims are to resolve
By interpreting your own daily experience through this lens, examining your routes, parking habits, seasonal patterns, and neighborhood changes, you can move from viewing auto insurance as a mysterious, one‑size‑fits‑all product to seeing it as a set of tools that can be calibrated to your specific circumstances.
A more academic, neighborhood-aware perspective does not require you to become an actuary or traffic engineer. It does, however, encourage you to ask more detailed questions about your exposure and to structure your coverage accordingly. When your policy reflects not just who you are but also where and how you drive in the Dayton area, your auto insurance becomes less an arbitrary expense and more a carefully considered component of your overall risk management strategy.
Protect Your Drive With Personalized Local Coverage
If you are ready to make sure your daily commute and weekend trips are properly protected, we are here to help. At Ingram Insurance Group, we take the time to match you with the right coverage and regional carrier options for reliable car insurance in Dayton. Reach out today so we can review your needs, compare options, and set up a policy that fits both your budget and your peace of mind.